
Tell me a story: Shaking up what’s interesting in your numbers
Working in the media department, I’ve been learning how to put together digital media reports. And I’ve learned that, while there is great power in facts and figures, a well-told story can move mountains. Numbers are forgotten over time. To engage our clients, we need to shape those numbers into stories.
In our reporting, we use colorful charts to tell a story about impact and growth. For example, in the stacked bar chart below, we show how social media and paid media affect overall website traffic. By breaking out the different traffic drivers, we show month-over-month increases and decreases in site traffic, as well as the dramatic consequences of pulling media campaigns in November.
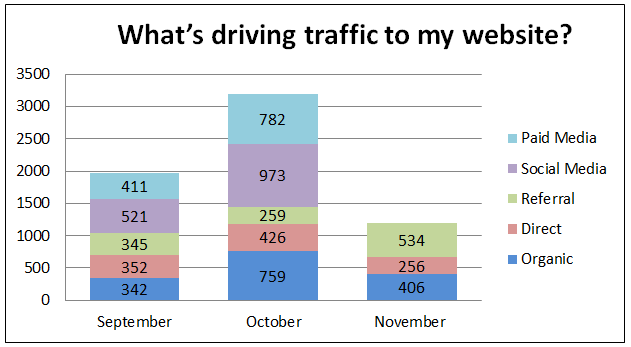
Using bright colors and simple shapes makes the data visually appealing and helps the audience understand the insights behind the numbers.
Know your audience. If your clients are familiar with analytics, you may want to tell your story with more emphasis on certain data to help them make more informed decisions, decide their next steps and see the bigger picture.
For instance, if your client is concerned with visitor retention, we might want to look at which traffic drivers yield higher bounce rates. We can break out new vs. returning visitors in a stacked bar chart and layer on the bounce rates associated with each traffic driver. In the chart below, referral traffic has the highest bounce rate (75%) and the lowest returning visitor percentage (12%). This tells us that we need to look into the links referring traffic to our site and make sure they are placed on the right websites.
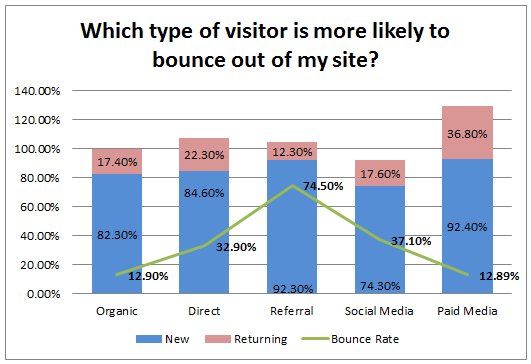
Charts like this allow you to show the relationship between two different sets of data to help tell the story of how they are connected.
We use storytelling in our digital media reports to show improvement with click-through rates, engagement on site and conversion. We let our charts tell the story, and we meet with our clients in a casual setting, encouraging questions and discussion so the meeting feels more like a conversation than a one-way presentation. Our goal is to give our clients information they can use to create and enhance their marketing campaigns, and keep them up-to-date on new analytics and the insights they provide.
So, what’s your story?
Sign up to receive our industry trends newsletter: